
Record Highs and Real Returns: Are You Actually Ahead?
The market keeps hitting record highs while inflation runs near 3.5%. Here is how to read your gains in real, after-inflation terms — and why the money illusion matters most in retirement.

The headline this week is a record. The S&P 500 is trading near 7,500, the Dow just booked its fourth straight winning month, and the broad market is up roughly 9% on the year. If you opened your statement this weekend, the number was bigger than the last time you looked. That feels like progress — and in one sense, it is.
But there is a second number hiding inside the first, and it is the one that actually pays your bills. Inflation cooled to about 3.5% in June, down from more than 4% this spring. Strip that out, and the market’s gain this year is closer to 5.5% than to 9%. Same statement, two very different stories.
Economists have a name for the gap between those two numbers: the money illusion — the very human habit of reading the bigger dollar figure and feeling richer, without subtracting what a dollar now buys. For a trader, the illusion costs a few basis points of clear thinking. For a retiree living off a portfolio, it can quietly reshape every spending decision you make. This one is worth getting straight.
Your statement is telling you two things at once
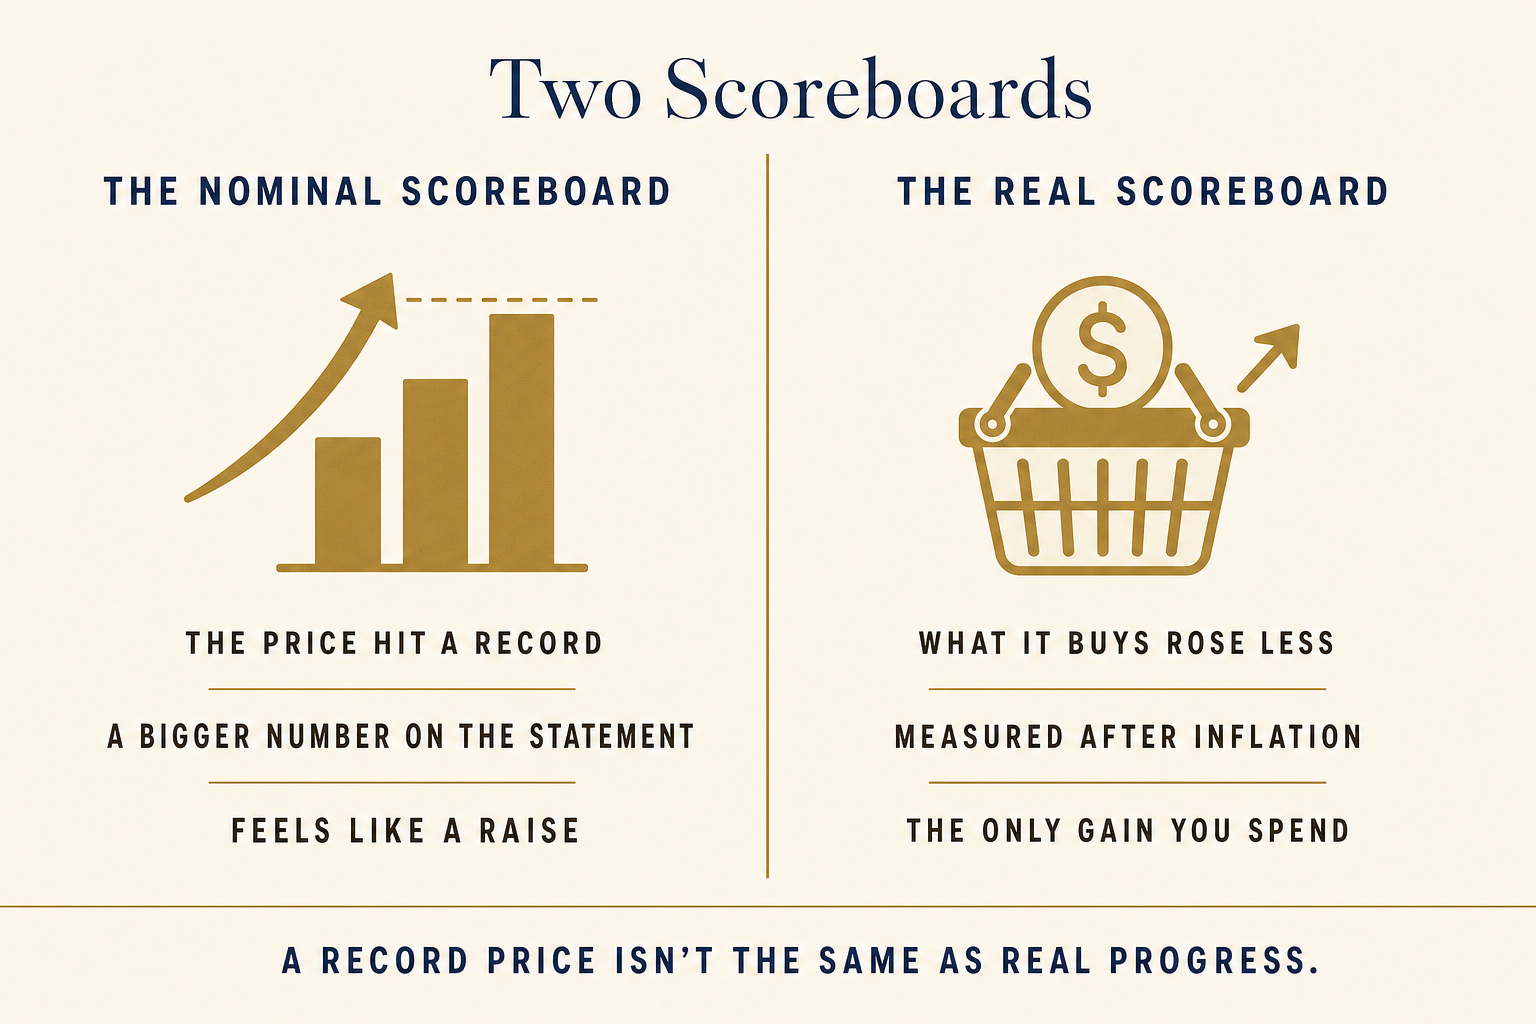
Every gain you see comes in two flavors, and most people only read one of them. The nominal return is the raw dollar figure — the price, the number on the statement, the “up 9%” in the headline. The real return is that same figure with inflation subtracted — what the money actually buys after prices have moved. A 9% nominal gain in a year of 3.5% inflation is about a 5.5% real gain.
That is not a knock on the market. A 5.5% real return is a genuinely good year — stocks earning their keep. The point is not that the gain is fake. The point is which number you are holding up against your life. Your grocery bill, your property-tax bill, and your Medicare premium are all quoted in nominal dollars, and they have been climbing right alongside your account. If you measure your progress in nominal terms and your costs in real ones, you will consistently feel further ahead than you are.
What “up 9%” actually bought this year
Apply the two-number habit to 2026 and the picture sharpens. The market’s roughly 9% nominal advance, minus inflation running near 3.5% per the Bureau of Labor Statistics, leaves a real gain in the mid-single digits. Real, worth having, and about 40% smaller than the headline suggests once you account for what it buys. It’s the same lens that explains why the official inflation number rarely matches what retirees feel at the register.
The same lens rearranges the whole “safe versus risky” conversation. Cash finally pays something again — with the Federal Reserve holding its policy rate steady this year, short-term savings and money-market yields sit near 4% — and that feels reassuring after a decade of nothing. But run it through the real filter: 4% nominal minus 3.5% inflation is a real return hovering just above zero. Cash is doing its job of staying safe and liquid, but it is not making your purchasing power grow. Stocks, by contrast, are one of the few asset classes that have historically outpaced inflation over long stretches — which is precisely the job they are hired to do in a retirement plan.
The record that isn’t quite a record
There is one more reason to hold a record high loosely: an index level is an average, and averages hide as much as they reveal. Even as the Dow logs its fourth straight winning month and the S&P sits near an all-time high, the tech-heavy Nasdaq 100 has slipped into a technical correction, down about 11% from its own peak. The market didn’t rise evenly — a handful of leaders carried the index while plenty underneath it fell.
A record for the index, in other words, is not automatically a record for what you own. If your portfolio leans toward the names that led, your statement may look nothing like the headline. If it leans toward the ones that lagged, the same is true in reverse. It is another version of the same lesson: the number on the screen is a summary, not your situation.
Why the illusion is a retirement problem, not a trivia question
While you are still working and adding money, the gap between nominal and real is mostly academic. You are a net buyer, time is on your side, and small measurement errors wash out over decades. The moment you retire and start spending from the portfolio, the same gap stops being academic and starts being your standard of living.
Here is why. In retirement you spend real dollars. The classic guideline of drawing around 4% a year is a real-terms idea — the withdrawal is meant to rise with inflation each year so your lifestyle holds steady. If your income grows more slowly than prices, your standard of living shrinks even while your account balance hits fresh records. You can watch your net worth climb and your buying power erode at the same time, and the money illusion is exactly what keeps you from noticing until it stings.
The one piece of most retirement income that adjusts for this automatically is Social Security, through its annual cost-of-living adjustment. Most pensions and basic annuity income are fixed in nominal dollars, which means inflation quietly chips away at them every year you own them. That is why I keep coming back to a point that sounds dull until you live it: the shape of your income floor and how much of it is inflation-protected matters more than any single year’s market number.
Consider a hypothetical case. Glenn and Patricia, both 66, live outside Raleigh, North Carolina with about $700,000 in their retirement accounts and roughly $5,000 a month in essential expenses. The market’s run has their statement at an all-time high, and it feels wonderful — so wonderful that Glenn floats the idea of raising their spending because “we’re clearly ahead.” That is the money illusion talking. Their nominal balance is at a record; their real progress this year is real but modest, and a good chunk of the run reflects prices rising, not their footing improving. The disciplined read is not to celebrate the record or fear it — it is to ask a plainer question: has our purchasing power actually grown enough to fund a bigger lifestyle for thirty years? Usually the honest answer is “a little, not a lot,” and the plan already tells them which dollars are safe to spend.
How bucket planning answers the real-return question before you ask it
This is where the Now, Soon, and Later framework does quiet work. Each bucket has a different relationship with inflation, and once you assign that job on purpose, a record-high headline stops demanding a decision.
The Now bucket is your near-term cash. You accept a real return near zero here, deliberately — its job is safety and liquidity so you never have to sell a growth asset at a bad moment, not to beat inflation. The Soon bucket is your guaranteed income floor: Social Security, any pension, and income-focused annuities, sized in today’s dollars to cover the essentials. Social Security is the piece that carries the COLA, which is a large part of why claiming strategy is worth so much attention — it is your one built-in inflation hedge on the income side. The Later bucket is the real-return engine. Stocks live there precisely because, over long horizons, equities have historically been one of the few things that grow purchasing power rather than just price. That is their assignment: to make sure your money buys more in twenty years, not merely that the number is bigger.
Structured that way, the architecture pre-answers the money illusion. You don’t have to feel your way through a record-high week, because you already decided which dollars are protected from inflation and which are working to beat it. If Glenn and Patricia want to know whether their buying power has genuinely improved enough to spend more, the move isn’t to eyeball the statement — it’s to model it. A tool like ProjectionLab lets you run your own plan in real, after-inflation terms and see whether a record-high balance actually changes what you can safely spend — often less than the headline makes it feel. (ProjectionLab is an affiliate partner; if you subscribe through that link, Confluence Media Group may earn a commission at no additional cost to you. I only point readers toward tools I’d actually use.)
Thomas’ Take: A record high is a fact about prices. Whether you are actually ahead is a fact about purchasing power — and those two facts only occasionally agree. The retirees who stay grounded are the ones who read both numbers and spend against the smaller one.
The bottom line
Records will keep coming, and so will the headlines celebrating them. Enjoy them for what they are — nominal milestones, evidence that the growth engine in your plan is running. Just don’t confuse a bigger number with a bigger life. The gain you actually get to spend is the one left standing after inflation takes its cut, and in a year like this one that gain is solid but a good deal quieter than the record on the screen. Measure your progress in the currency you actually live in, let each bucket do its assigned job, and a record high becomes what it should be: good news you don’t have to act on.
Key takeaways
- Nominal is the price; real is the purchasing power. Subtract inflation from any gain to see the number you actually get to spend.
- A roughly 9% year at 3.5% inflation is about a 5.5% real gain — genuinely good, but noticeably smaller than the headline once you account for costs.
- Cash near 4% barely clears inflation. Its job is safety, not growing your buying power; stocks are the historical inflation-beater.
- The illusion bites hardest in retirement, when you spend real dollars and only Social Security’s COLA adjusts automatically.
- Bucket planning assigns each dollar an inflation job in advance, so a record-high headline never forces a decision.
Frequently asked questions
Is a record high a signal to sell?
A record is a statement about where prices are, not a forecast of where they go next. Markets spend much of their history near highs, and trying to time an exit means being right twice — on the way out and on the way back in. A durable plan decides how much market exposure you carry based on your income floor and time horizon, not on whether today’s number is a record.
Doesn’t holding cash protect me from inflation?
Cash protects you from market volatility, not from inflation. When savings yields sit near 4% and inflation runs near 3.5%, your real return is barely above zero — you’re preserving dollars, not growing what they buy. That is exactly why the Now bucket holds only what you need soon, while longer-term money stays in assets that have historically outpaced rising prices.
How do I figure out my own real return?
Start with your nominal return for the period, then subtract the inflation rate over the same stretch. If your accounts grew 8% and inflation ran 3.5%, your real return was about 4.5%. For retirement decisions, the more useful exercise is to model your whole plan in inflation-adjusted terms so your projected income and spending are both measured in the currency you’ll actually live on.
This article is published by Confluence Media Group LLC, an independent publisher of educational financial content. Thomas Clark is a Series 65 Investment Advisor Representative. The information provided is for educational and informational purposes only and is not personalized financial, tax, or legal advice. Past performance does not guarantee future results. All investing involves risk, including potential loss of principal. Consult a qualified professional before making financial decisions.
Confluence Media Group LLC is a separate entity from Confluence Capital Management, the investment advisory practice through which Thomas Clark provides advisory services. Advisory services are not offered through this publishing platform.
About Thomas Clark
Thomas Clark is the founder of Confluence Media Group LLC and a Series 65 Investment Advisor Representative. He has spent nearly two decades working with families on retirement planning, with a focus on Social Security optimization, retirement income coordination, and the bucket planning approach to building a guaranteed income floor.
Thomas writes and publishes at thomasclarkadvisor.com and is the author of The Just in Case Binder — a 148-page printable family financial organizer for households who want to make sure the people they love know where everything is.
He lives in North Carolina with his family.
Subscribe to the weekly newsletter · Get the Just in Case Binder

Thomas Clark is a Series 65 licensed investment advisor and experienced trader. He specializes in investing, retirement planning, and market analysis, helping individuals build wealth and make informed financial decisions.
