
The Retirement Spending Smile: Why Spending Isn’t Flat
Most retirement calculators assume you'll spend the same amount every year for 30 years. Real spending follows a smile — and the shape changes how much you actually need to retire.
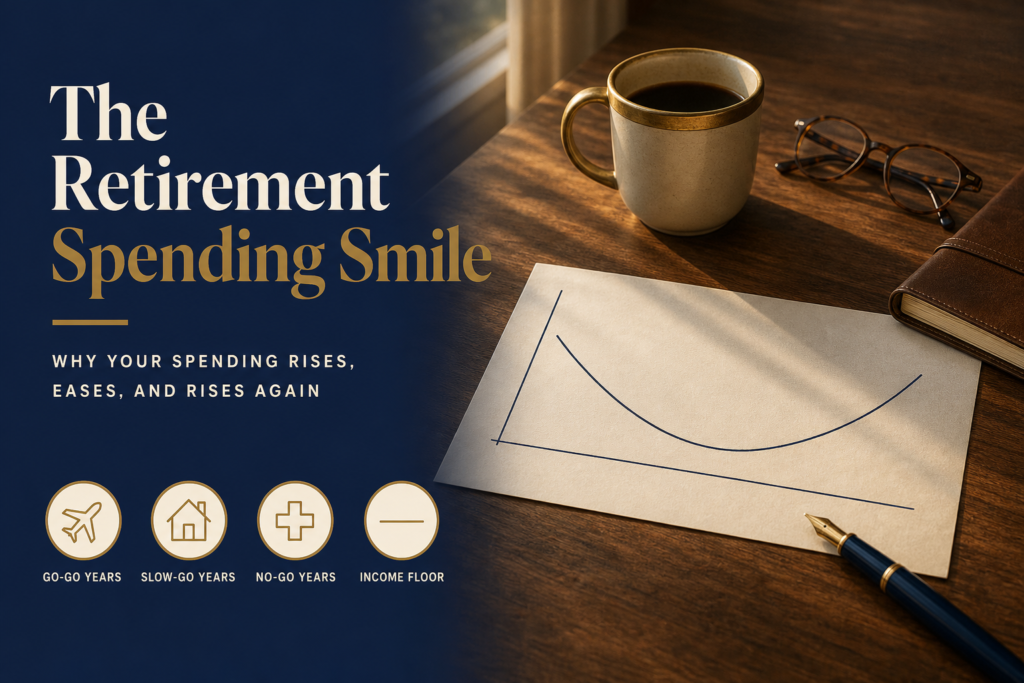
The retirement number your calculator handed you rests on a quiet assumption: that you’ll spend the same amount, adjusted for inflation, every single year from the day you retire until the day you die. Thirty years of identical spending. It’s a tidy assumption, and it’s almost certainly wrong.
Real retirees don’t spend in a flat line. They spend in a curve — researchers call it the retirement spending smile. Understanding the shape of that curve changes two things at once: how much you actually need to retire, and how much of your one healthy decade you’re willing to let yourself enjoy.
The flat-line assumption hiding in your plan
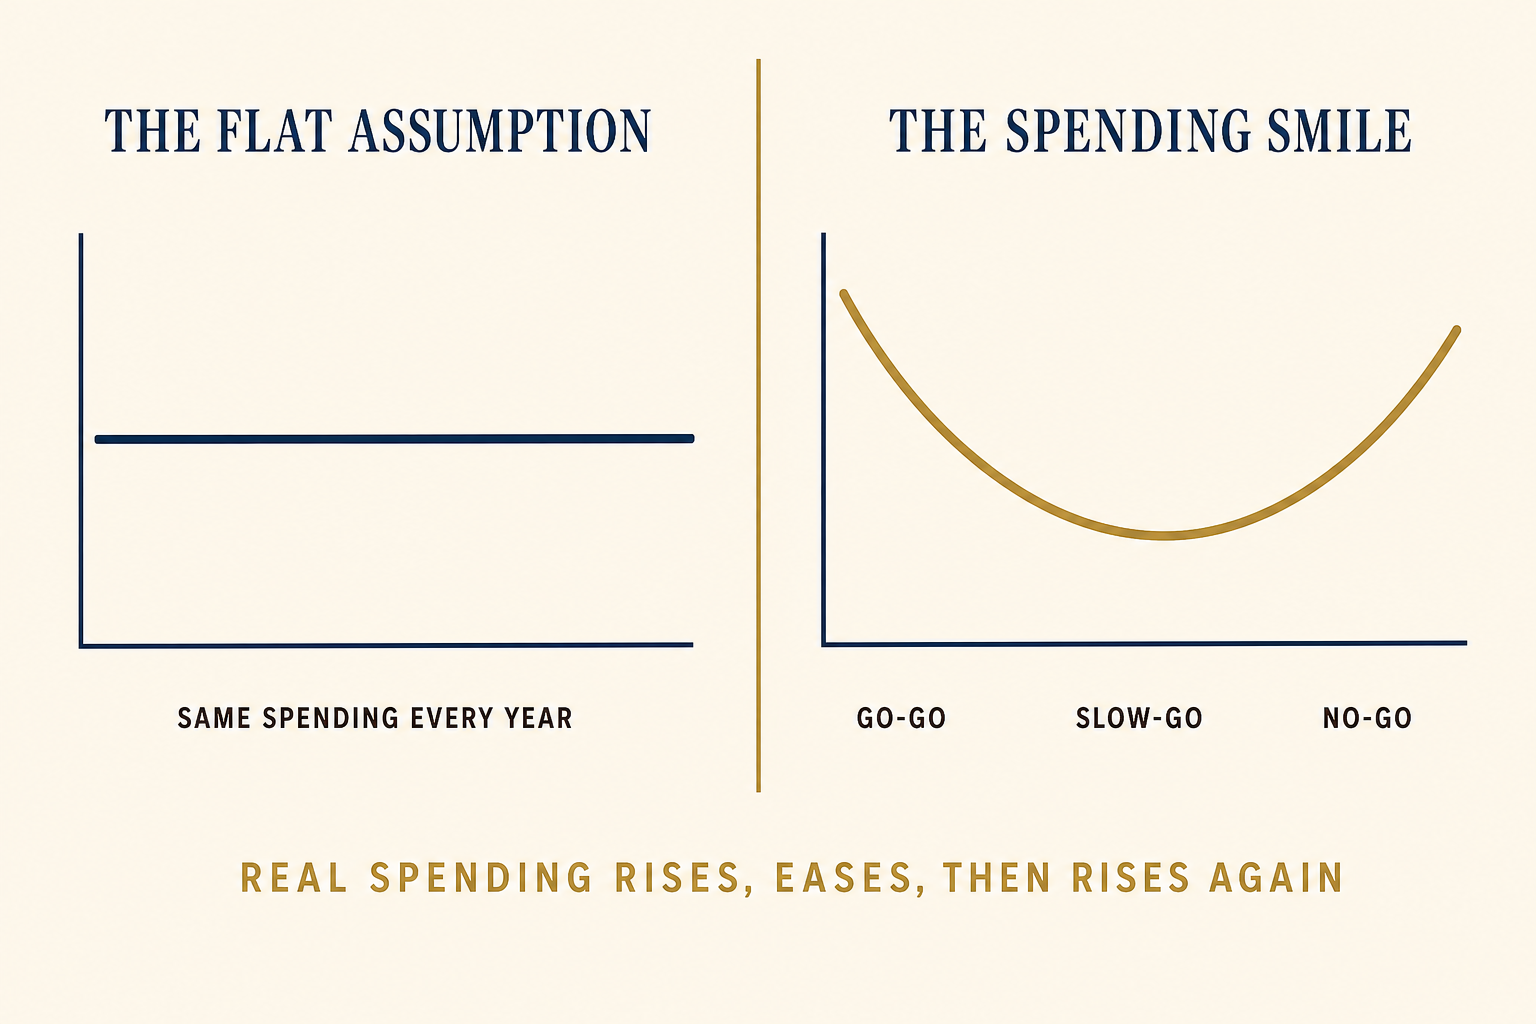
Most retirement calculators — and most of the advice built on top of them — model spending as a straight, inflation-adjusted line. You tell the tool you’ll spend $70,000 a year, it grows that figure by roughly 3% annually, and it asks whether your savings can sustain it to age 95.
That math is convenient. A single number, compounded forward, is easy to model and easy to explain. The problem is that it describes a retiree who doesn’t exist: someone who spends exactly as much at 88 as they did at 66, just with bigger numbers on the checks.
If you’ve watched your own parents age, you already know that’s not how it goes. Spending shifts as life shifts. And the flat line, by ignoring that, quietly overstates what most households will actually spend across retirement — and therefore how much they think they need to save before they can walk away from work.
What the research actually shows
The shape has a name because someone measured it. Retirement researcher David Blanchett studied thousands of households and found that real, inflation-adjusted spending tends to decline through much of retirement — often around 1% a year — before curving back up near the end as health costs rise. Plotted over time, it looks like a shallow smile: higher on both ends, lower through the middle.
Financial planner Michael Stein gave the phases the names that stuck: the go-go years, the slow-go years, and the no-go years.
- Go-go years (roughly 60s to early 70s): you’re newly free and still healthy. This is when travel, projects, second homes, and time with the grandkids cost the most.
- Slow-go years (mid-70s to early 80s): the pace naturally eases. You travel less, eat out less, and spend more time close to home. Discretionary spending drifts down without much effort or sacrifice.
- No-go years (mid-80s onward): activity is limited more by energy and health than by budget — but health care and potential long-term care costs climb.
Government data backs the pattern up. In the Bureau of Labor Statistics Consumer Expenditure Surveys, average household spending for the 75-and-older group runs meaningfully below the 65-to-74 group — driven by lower spending on transportation, food, and entertainment, even as health care claims a bigger share of what’s left.
One honest caveat before we build anything on this: the smile is a pattern across many households, not a promise about yours. A household that faces years of long-term care can watch the right side of the curve turn from a gentle rise into a steep climb. We’ll come back to that, because planning for it is the whole game.
Why spending falls — and where it doesn’t
Two forces pull mid-retirement spending down. The first is simply health and energy: an 80-year-old does less than a 66-year-old, and doing less costs less. The second is that the big one-time surges — the celebration trip, the kitchen remodel, helping a kid with a down payment — tend to cluster in the early years and then fade.
Some costs move the other way. Health care rises steadily and can spike late; Fidelity’s widely cited estimate of lifetime retiree health care costs runs well into six figures for a 65-year-old couple. Long-term care, if you end up needing it, is the single biggest wildcard in any retirement plan. Those costs are the right side of the smile — the reason the curve eventually turns back up.
And some costs barely move at all. A paid-off house — property taxes aside — is one of the great inflation-and-aging hedges a household owns: your single largest monthly line item stays roughly flat while nearly everything around it shifts. It’s a point I keep coming back to when readers ask what inflation actually erodes in retirement.
Thomas’ Take: the real risk isn’t running out
Here’s where I part ways with a lot of retirement content. Nearly all of it is organized around a single fear — running out of money. That fear is worth respecting, and I’m not going to tell you to ignore it. But in nearly two decades of doing this work, the more common regret I’ve watched play out isn’t the retiree who ran out. It’s the retiree who died with a large balance they spent thirty years being too afraid to touch.
The flat-spending number feeds that fear. When a calculator tells a 65-year-old they have to spend the same real amount at 90 as at 65, it makes their healthy go-go decade look unaffordable. So they trim the early years — the one stretch of retirement when their health actually lets them enjoy the money — to protect a version of themselves at 90 who, the data suggests, will spend far less than the spreadsheet assumed.
If the research is even roughly right, the typical retiree can spend somewhat more in the early years than a flat line allows, precisely because the middle years will cost less. Under-living your go-go years to fund a 90-year-old who spends like a 66-year-old is planning for a person who won’t exist. That’s not frugality. That’s a forecasting error with your best years as the cost.
What the smile means for your plan
None of this is a reason to throw out your plan. It’s a reason to shape it around the curve instead of a straight line. The bucket approach I use — a Now bucket for near-term cash, a Soon bucket for guaranteed income, and a Later bucket for growth — maps onto the smile almost perfectly.
- Front-load the go-go years on purpose. Build a deliberately larger discretionary allowance into your early-retirement draw, while your health allows it. Give yourself the permission the spreadsheet won’t.
- Anchor essentials to a guaranteed income floor. Your essential spending — housing, food, utilities, insurance — is the stickiest part of the budget and the part that must never depend on the market. Cover it with guaranteed sources: Social Security, any pension, and, where it fits, an income-focused fixed index annuity in the Soon bucket. When the essentials are guaranteed for life, the discretionary spending stacked on top can flex up in good years and down in lean ones without ever threatening the roof over your head.
- Delay Social Security to fund the long tail. Every year you delay claiming from full retirement age to 70 raises your benefit by about 8% a year, guaranteed and inflation-adjusted for life. That larger check does its most important work on the right side of the smile — the late years, when a surviving spouse may be living on a single benefit and health costs are climbing.
- Reserve for the right side of the smile. Earmark part of the Later bucket for the late-life health care and long-term care uptick, so the tail of the curve never forces you to sell growth assets at the wrong moment. If you’re planning for long-term care without insurance, this reserve is where that plan lives.
A hypothetical: same savings, two different plans
Consider a hypothetical couple. Ray and Joan, both 65, are retiring this year in suburban Charlotte with $900,000 saved, a paid-off house, and about $4,500 a month in combined Social Security. Their essential expenses run roughly $4,200 a month.
A flat-line calculator assumes they’ll spend, say, $78,000 a year in today’s dollars every year to age 95. Under that assumption their go-go years look tight, and the tool nudges them to hold back early — just in case.
Model the smile instead, and the picture changes. If Ray and Joan front-load the travel they actually want at 66, 68, and 70 — spending closer to $90,000 in those years — then let spending drift toward $65,000 through their slow-go 70s, the lifetime total can land right around, or even below, the flat plan’s. The difference isn’t in how much they spend over the whole retirement. It’s in when. And the “when” is the part that decides whether they see the national parks while they can still hike them.
The exact figures don’t matter here — those depend entirely on your own numbers, and this is a hypothetical, not a recommendation. What matters is the lesson underneath it: a flat assumption and a curved reality can produce very different advice from the identical pile of savings.
This is worth modeling rather than guessing at. A planning tool like ProjectionLab lets you build a spending path that actually changes over time — higher in the early years, lower through the middle, with a health care reserve for the end — instead of a single flat line, and then shows you what each shape does to the odds your money lasts. (ProjectionLab is a paid tool; the link is an affiliate link, which means I may earn a small commission at no extra cost to you. I only recommend tools I’d use myself.)
Key takeaways
- Most retirement calculators assume flat, inflation-adjusted spending for 30 years — a convenient assumption that describes a retiree who doesn’t exist.
- Research (David Blanchett’s “spending smile”) and BLS spending data show real spending typically declines through mid-retirement, then rises late as health costs climb.
- The three phases: go-go (you spend the most), slow-go (spending eases on its own), and no-go (activity is limited by health, while health care rises).
- The more common regret isn’t running out of money — it’s under-living the healthy years out of fear of a flat number.
- Shape your plan to the curve: front-load the go-go years, cover essentials with a guaranteed floor, delay Social Security, and reserve for the late-life tail.
Frequently asked questions
Doesn’t a big long-term care bill ruin this whole idea?
It can flip the right side of the smile from a gentle rise into a steep climb — which is exactly why the plan above keeps a dedicated reserve for it. The spending smile is your base case; long-term care is the tail risk you plan around it, not instead of it. Ignore the smile and you’ll over-save and under-live; ignore the tail and one long care event can undo the plan. You need both.
So should I just spend more early and stop worrying?
Not blindly. The case for spending more in the go-go years only holds once your essentials are covered by guaranteed income and you’ve reserved for the health care tail. Build the floor first. Then — and only then — the discretionary spending stacked on top can safely flex higher in the early years.
How is this different from the 4% rule or spending guardrails?
The 4% rule and spending guardrails are about how much to withdraw and how to adjust it year to year. The spending smile is about the shape of your spending across decades. They work together: the smile tells you roughly what your spending curve should look like, and guardrails tell you how to respond when the markets don’t cooperate along the way.
Plan for the curve, not the line
The flat line is a modeling convenience, not a life. Real retirement spending rises, eases, and rises again — and the plan that respects that shape is the one that lets you spend on the years you’ll actually live, instead of the identical thirty a spreadsheet imagined. The reluctance to spend is real, and I’ve written before about the psychology behind it. But the antidote isn’t a bigger number. It’s a better-shaped one. Plan for the curve, protect the tail, and give yourself permission to enjoy the decade when you can.
This article is published by Confluence Media Group LLC, an independent publisher of educational financial content. Thomas Clark is a Series 65 Investment Advisor Representative. The information provided is for educational and informational purposes only and is not personalized financial, tax, or legal advice. Past performance does not guarantee future results. All investing involves risk, including potential loss of principal. Consult a qualified professional before making financial decisions.
Confluence Media Group LLC is a separate entity from Confluence Capital Management, the investment advisory practice through which Thomas Clark provides advisory services. Advisory services are not offered through this publishing platform.
About Thomas Clark
Thomas Clark is the founder of Confluence Media Group LLC and a Series 65 Investment Advisor Representative. He has spent nearly two decades working with families on retirement planning, with a focus on Social Security optimization, retirement income coordination, and the bucket planning approach to building a guaranteed income floor.
Thomas writes and publishes at thomasclarkadvisor.com and is the author of The Just in Case Binder — a 148-page printable family financial organizer for households who want to make sure the people they love know where everything is.
He lives in North Carolina with his family.
Subscribe to the weekly newsletter · Get the Just in Case Binder

Thomas Clark is a Series 65 licensed investment advisor and experienced trader. He specializes in investing, retirement planning, and market analysis, helping individuals build wealth and make informed financial decisions.
