
September Is the Worst Month for Stocks. Usually.
September is the stock market’s only month with a negative average return in nearly a century — but a base rate isn’t a forecast, and the one condition that flips it is true right now.

Tomorrow is September 1, and if you follow markets even loosely, you’ll spend the next few weeks hearing that September is the worst month of the year for stocks. It’s the one piece of market seasonality that actually shows up in the data — not a superstition, a genuine pattern. Going back to 1928, September is the only month of the twelve that has produced a negative average return.
So let me say the useful part before the scary part does its work: an average is a base rate, not a forecast. “September loses on average” and “September will lose this year” are two completely different statements, and the gap between them is where most bad decisions live. There’s even a specific reason this September’s odds may look nothing like the century-long average.
Here’s what the September record actually says, why the month earned its reputation, and why — for anyone with a real retirement plan — the right response is almost aggressively boring.
The one month with a losing record
The numbers are real, and they’re worth stating plainly. Going back to 1928, the S&P 500 has averaged roughly a 1% decline in September. Every other month averages a gain. Narrow the window to the past 75 years and it’s about the same story — September comes in around negative three-quarters of a percent, dead last. And it’s not just the average: since 1950, September has finished higher only about 44% of the time, the lowest positive rate of any month. Investopedia has a clean writeup of the so-called September Effect if you want the long history.
Traders gave it that name precisely because it’s persistent enough to notice. When one month out of twelve carries a losing record across nearly a hundred years, that’s not random noise you can wave away. It’s a real, if modest, tilt.
Why September, of all months?
Here’s where my years around trading desks are more useful than any chart. Nobody can prove exactly why September underperforms, but the leading explanations all share a theme: it’s the month the professionals get back to work.
Summer trading is thin — desks are half-staffed, volume is light, and prices drift along on autopilot. After Labor Day, the institutions come back and reposition all at once. Many mutual funds run a fiscal year that ends in October, so September is when they sell their losers to clean up the books before the year closes, and that tax-loss selling lands disproportionately in this one month. Add ordinary portfolio rebalancing, and the simple fact that a reputation, once earned, becomes partly self-fulfilling: enough people expect September weakness that some of them sell into it, which helps produce the very weakness they feared.
None of these forces is dramatic. Together they add up to a small, real headwind — a fraction of a percent, on average. That “on average” is doing enormous work, and it’s the part almost every headline drops.
A base rate is not a forecast
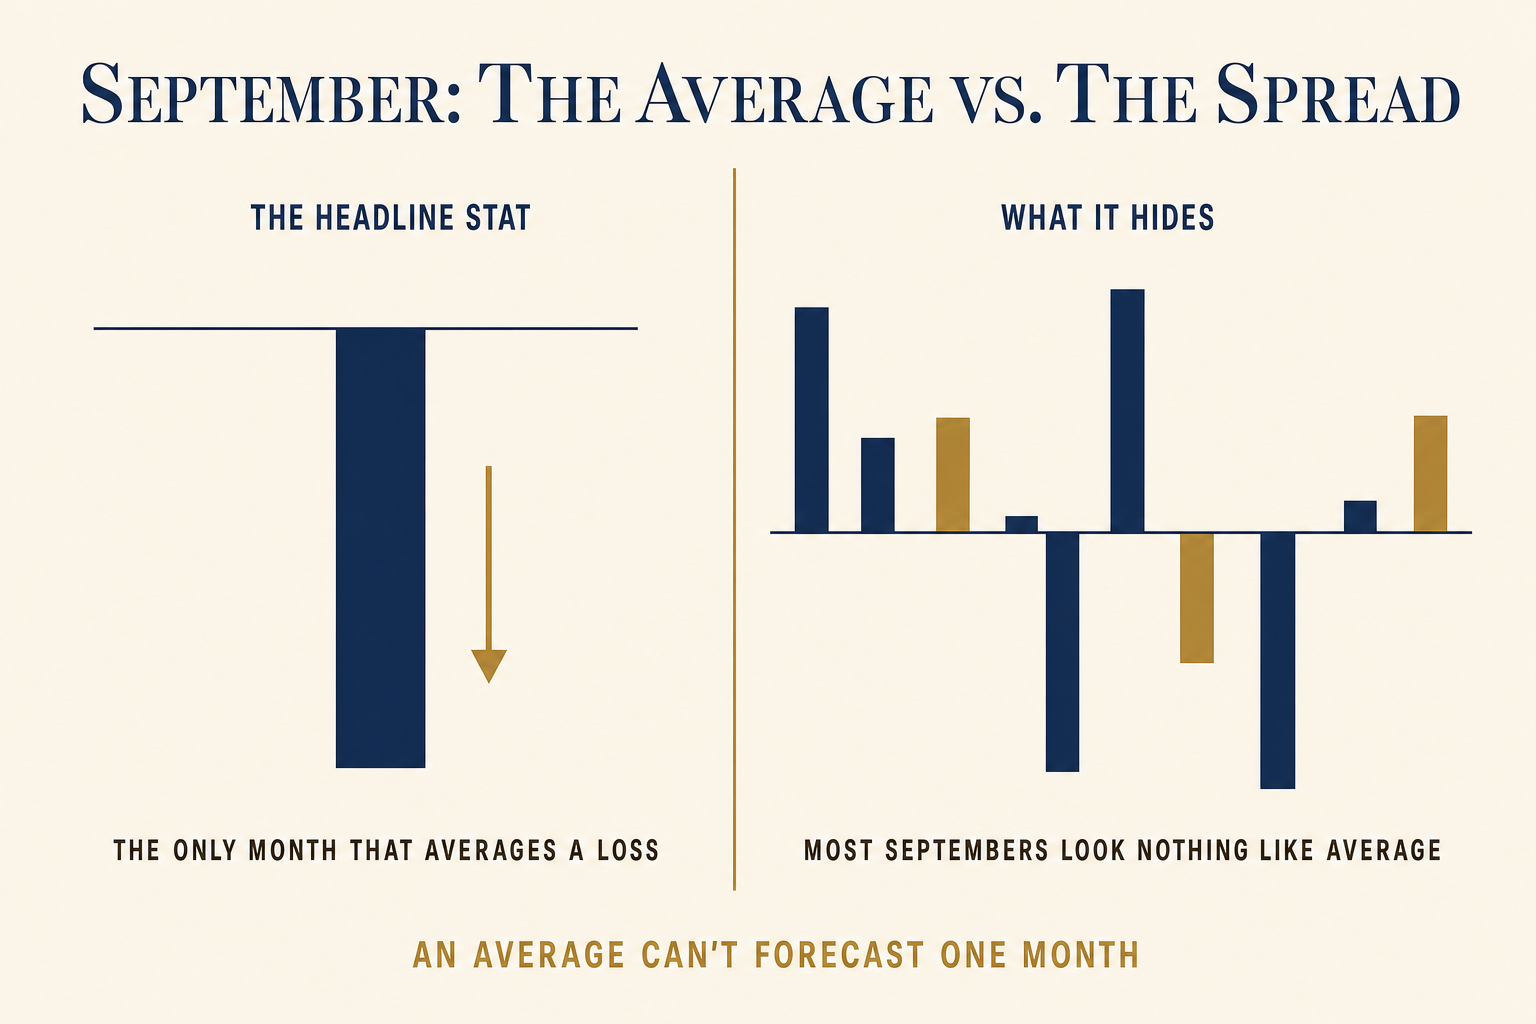
Here is the number that should reset your blood pressure: that scary September average is built from individual Septembers that look nothing like it. The month’s worst reading ever was September 1931, when the market fell nearly 30% in the depths of the Depression. That single catastrophe drags a whole century’s average down by itself. Strip out the handful of true disasters and most Septembers are unremarkable — some up nicely, some down a little, clustered around flat.
This is the same trap people fall into with an “expensive” market, which I wrote about last week: a statistic that’s genuinely informative over a long horizon becomes almost useless as a prediction about the next few weeks. A minus-1% average across a hundred Septembers can’t tell you what this September will do, any more than a coin that’s come up tails slightly more than half the time over a thousand flips can tell you anything about the next flip. The edge is real. It’s also tiny, and in any single year it’s swamped by everything else going on.
The one condition that flips it
And “everything else going on” is exactly why this September may not resemble the average at all. There’s a well-documented wrinkle in the seasonality data that rarely makes the headlines: the September Effect largely fades — and often reverses — when the market enters the month in an uptrend.
Market historians have pointed out that when the S&P 500 begins September above its 200-day moving average — a simple, widely watched gauge of whether the longer trend is still pointing up — the month’s historical average has actually been positive, with gains more often than losses. The dismal full-sample number is dominated by Septembers that began in already-weakening markets.
As of late August 2026, the S&P 500 is sitting at record highs, comfortably above its 200-day average, with the Federal Reserve widely expected to cut rates and inflation data cooperating. In other words, the market is entering September in precisely the condition under which the “worst month” pattern has historically been weakest, or absent altogether. That is not a prediction that stocks will rise. It’s the opposite point: the base rate everyone’s about to quote at you may be the wrong base rate for this particular year.
Thomas’ Take: Seasonality is a starting point for a question, never an answer. “September is weak” is a fact about a hundred years of data. “September will be weak this year, in a market at new highs, so I should get out” is a forecast wearing a fact’s clothing — and dressing a guess up in a statistic doesn’t make it any less of a guess.
What you’d actually do about it — nothing, on purpose
Step back and ask the question that cuts through all of it: even if you knew for certain that September would be down, what would you actually do?
If your honest answer is “sell some stocks and buy back in later,” you’re describing market timing — a strategy that requires being right twice, costs you taxes and missed gains every time you’re wrong, and that regulators like FINRA warn against for good reason. If your answer is “nothing,” then the September forecast was never decision-relevant in the first place, and you can stop reading the seasonality takes entirely.
For a retiree, “nothing” should be the answer — and it should be the answer by design. This is the whole point of the Now, Soon, Later bucket framework. A down September only hurts you if it forces you to sell shares to pay a bill, so you build a plan where it can’t. Your Soon-bucket income floor — Social Security, any pension, and income-focused instruments — covers your essential expenses no matter what the market does that month. Your Now bucket holds a couple of years of spending in cash, so a weak stretch is something you wait out rather than sell into. And your Later bucket, the growth money, isn’t money you’re touching in September, or this year at all.
Arrange your money that way and the calendar becomes weather. You can notice it’s a stormy month without rearranging your life around the forecast. It’s the same reason I’ve argued you don’t have to watch the Fed: when your bills are covered by guaranteed income, the headlines lose their grip on you.
A hypothetical worth keeping in mind
Consider a hypothetical case, using round numbers for illustration and not a projection. Gloria is 66, retired last year, and used to dread the fall — every September dip felt like it was aimed squarely at her savings. Her essential bills run about $3,200 a month. Social Security and a small pension cover roughly $3,000 of that, and she keeps two years of spending in cash in her Now bucket. The remaining $180,000 or so of her retirement money sits in her Later bucket, invested for growth she won’t need to draw on for years.
Now suppose September lives all the way up to its reputation and her Later bucket falls 6%. On paper, she’s down real money. In her actual life, nothing happens. Her income floor deposits the same amount it always does. Her cash covers the small monthly gap. She doesn’t sell a single share, because she doesn’t have to — and by the time she’d ever need that growth money, this September will be a forgotten squiggle on a long chart. The difference between the Gloria who dreaded September and the Gloria who ignores it isn’t a better market forecast. It’s a structure that made the forecast irrelevant.
What to actually take away
September’s bad reputation is one of the few pieces of market seasonality backed by real data — and it’s still almost useless for making a decision. Respect the statistic for what it is, and don’t ask it to be something it isn’t.
- September really is the market’s weakest month on average — the only one with a negative average return in nearly a century of data. That part isn’t a myth.
- But an average built from a hundred wildly different years can’t forecast any single September. The edge is real and tiny, and it’s swamped by everything else in any given year.
- The pattern is historically weakest — even reversed — when the market enters September in an uptrend, which is exactly the setup right now. The scariest base rate may be the wrong one for this year.
- If you’d do nothing differently even knowing September would fall, the forecast was never decision-relevant. Build a plan where “nothing” is the right move on purpose.
The goal was never to predict September. It’s to own a plan that doesn’t care what September does — so that when the “worst month” headlines roll in tomorrow, right on schedule, you can read them the way you’d read a weather report for a city you don’t live in. Interesting, maybe. Not yours to act on.
This article is published by Confluence Media Group LLC, an independent publisher of educational financial content. Thomas Clark is a Series 65 Investment Advisor Representative. The information provided is for educational and informational purposes only and is not personalized financial, tax, or legal advice. Past performance does not guarantee future results. All investing involves risk, including potential loss of principal. Consult a qualified professional before making financial decisions.
Confluence Media Group LLC is a separate entity from Confluence Capital Management, the investment advisory practice through which Thomas Clark provides advisory services. Advisory services are not offered through this publishing platform.
About Thomas Clark
Thomas Clark is the founder of Confluence Media Group LLC and a Series 65 Investment Advisor Representative. He has spent nearly two decades working with families on retirement planning, with a focus on Social Security optimization, retirement income coordination, and the bucket planning approach to building a guaranteed income floor.
Thomas writes and publishes at thomasclarkadvisor.com and is the author of The Just in Case Binder — a 148-page printable family financial organizer for households who want to make sure the people they love know where everything is.
He lives in North Carolina with his family.
Subscribe to the weekly newsletter · Get the Just in Case Binder

Thomas Clark is a Series 65 licensed investment advisor and experienced trader. He specializes in investing, retirement planning, and market analysis, helping individuals build wealth and make informed financial decisions.
